Turbidity sensing principle and design
Our latest turbidity sensor is the one we use in our mixing tank experiments and is based on a simple turbidity sensing principle. Also, if you want to build this sensor yourself then I suggest you check out this and this post. But before I was able to design this prototype, a lot of work went into eliminating some bad designs.
What I would like to do in this post is outline the sensing principle of a turbidity sensor and then go through the different design elements that didn’t work for our sensor and why, and finally the design I settled on. Here’s a breakdown of the different sections of this post:
- turbidity sensing principle
- prototype 1.0
- Formazin experiments
- effect of adding focusing lenses
- effect of detector orientation
- effect of ambient light and long-pass filters
- prototype 2.0 – latest design
Turbidity sensing principle
Current commercial turbidity sensors are expensive (e.g. state-of-the-art turbidity sensor by Campbell is about 6000EUR, In-Situ is 7000EUR). This makes widespread deployment at many sites along a river system, or glacial stream, or fishery, or at every manufacturer’s effluent stream, next to impossible. For this reason, several novel and low-cost turbidity sensors have been documented in peer-reviewed literature. For a complete summary, please see the introduction section of our preprint, which is available here.
In general, these sensors work on a basic turbidity sensing principle: they illuminate a water sample with a light source (LED, laser) and detect the quantity of scattered light at an offset angle to the light source. I will not go into the details of this sensing principle; there are great sources such as by Sadar (1998).
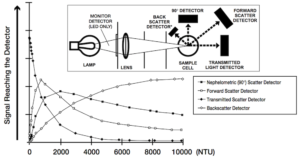
Generally, the detectors are placed at different angles relative to the incident light source. For example, at 180° the turbidity sensor works on the principle of light attenuation (the more particles in the water sample, the less light reaches the detector). And a detector at 90° to the incident beam is called “nephelometry” and gives a different curve for the quantity of light detected. Both of these detectors, and detectors at other angles, are shown in the image from Hach to the right.
Prototype 1.0
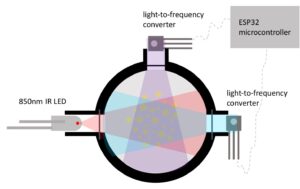
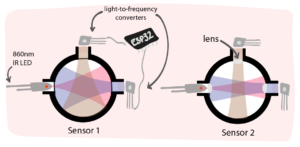
With these general turbidity sensing principles in mind, I made a first prototype of the open-source sensor. The basic design of the sensor was to use an infrared (IR) LED and two light detectors at different angles relative to the LED. You can see the design in the image to the left. I selected an LED at 850nm (TSHG6200 by Vishay Semiconductor Opto Division) because water as a medium does not reflect this wavelength. And I chose the TSL237S-LF detectors by AMS for two reasons. 1) They convert light to a digital output frequency and so variations in voltage or current driven by temperature fluctuations in the field environment, that affect an analog detector, are eliminated. 2) This sensor responds to light in the 320nm to 1050nm range and has a peak responsivity at 700nm.
I also chose an ESP32 as the microcontroller for this sensor instead of an Arduino Uno because of its superior number of timers. The detectors output a digital pulse with varying frequency proportional to the light intensity. Therefore, the chosen microcontroller should have at least two timers to compute frequency, one to count pulses and one to count the elapsed time, for each detector. The Arduino can only be used to convert the digital output of one detector. Whereas the ESP32 has the required four timers to resolve the digital signal of two detectors.
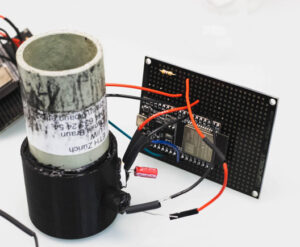
I made a simple sensing “head” (which houses the LED and detectors) in Solidworks and 3D printed this piece (check the image to the right, you can find the CAD files at this github repo). To prevent internal reflections within the sensor head, I chose black PLA filament. This 3D printed sensor head was attached to a grey PVC tube to minimize stray ambient light and to hold a larger sample volume. Attached to the sensor head and grey PVC tube is a prototyping breadboard that held the electronic components. You can see all three in the image to the right. I think this prototype costed less than 20EUR and can be easily used as desktop sensor.
Multiple versions of prototype 1.0
The four sensor versions are summarized in the table below:
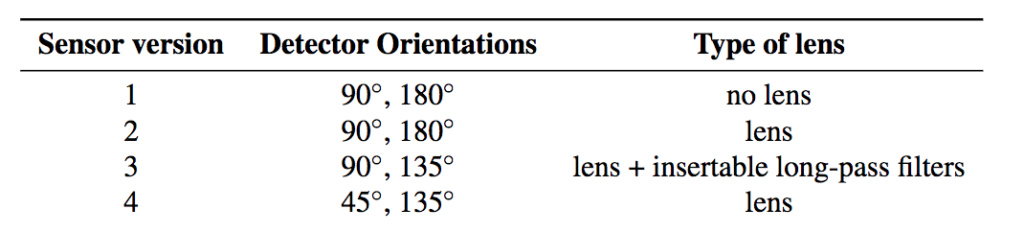
These are going to be used in the next section to run the different experiments. The flat glass is used in Sensor version 1 (“no lens”) to separate/protect the LED and detectors from the liquid sample. The rest of the sensors use lenses that are plano-convex and made of H-K1 glass with a 6mm diameter and an 8.873mm focal length. And I made Sensor 3 so that I could easily insert/remove long-pass filters. These long-pass filters pass everything longer than 750nm, so all visible light shouldn’t be able to reach the detectors but the 850nm LED signal should be able to.
To take a measurement with these sensors, I poured a sample into the grey PVC + 3D printed sensing head. Since the detectors output a digital frequency, I wrote a pulse-counting program to compute the frequency from both detectors simultaneously. This program was based on David Antliff’s frequency_count.h library and the full code is found at this repo. The principle behind the pulse-counting program is that it uses one timer to count the number of digital pulses while the second timer simultaneously counts the amount of time elapsed. This gives one frequency datapoint in hertz. For all of our measurements, we consider one frequency measurement to be an average of 10 frequency datapoints (number of pulses divided by the elapsed time) taken in the span of a few miliseconds. Additionally, we had the sensor take one measurement with the LED off and another with the LED on. Then we took the difference between these two measurements to try and eliminate as much stray light as possible.
Formazin experiments
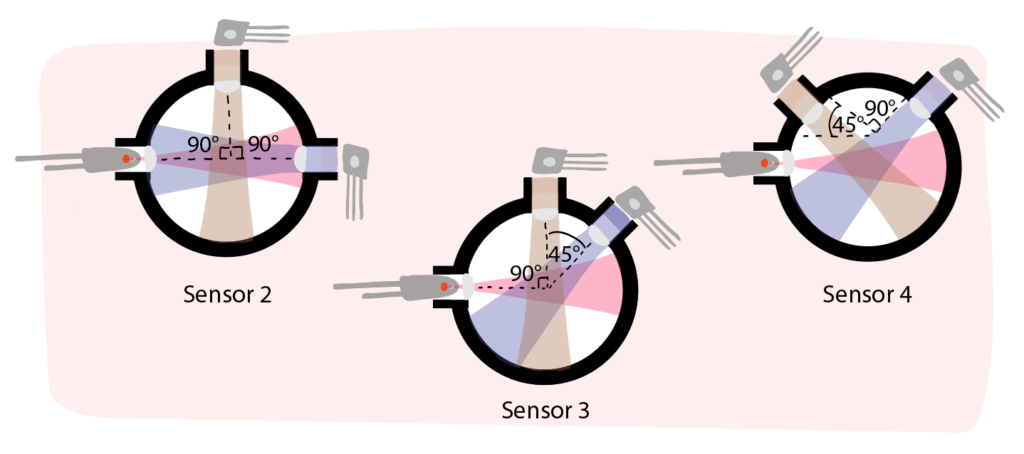
To select the version of the sensor that works best for turbidity measurements, we designed and ran three experiments. First, we wanted to see the difference between using flat glass or focusing lenses (using Sensors 1 & 2) in the first experiment. In the second experiment, we wanted to know what detector angles relative to the LED gave the best results in the full 0-4000 NTU range (using Sensors 2, 3 & 4). So, we tested three detector angles relative to the LED: 90° and 180°, 90° and 135°, and 45° and 135°. In the last experiment, we wanted to understand the effect of ambient light leakage and whether the long-pass filters could minimize the ambient light interference (using Sensor 3 with & without the long-pass filters).
To run the experiments, we made several dilutions of Formazin, a popular calibration liquid for turbidity sensors. The Formazin that we purchased was rated at 4000NTU and we created dilutions using deionized water: 0, 2, 4, 6, 8, 10, 20, 40, 60, 80, 100, 250, 500, 800, 1000, 2000, and 4000 NTU.
We then poured each Formazin dilution into the Sensors 1-4 to carry out the experiments.
Effect of adding focusing lenses
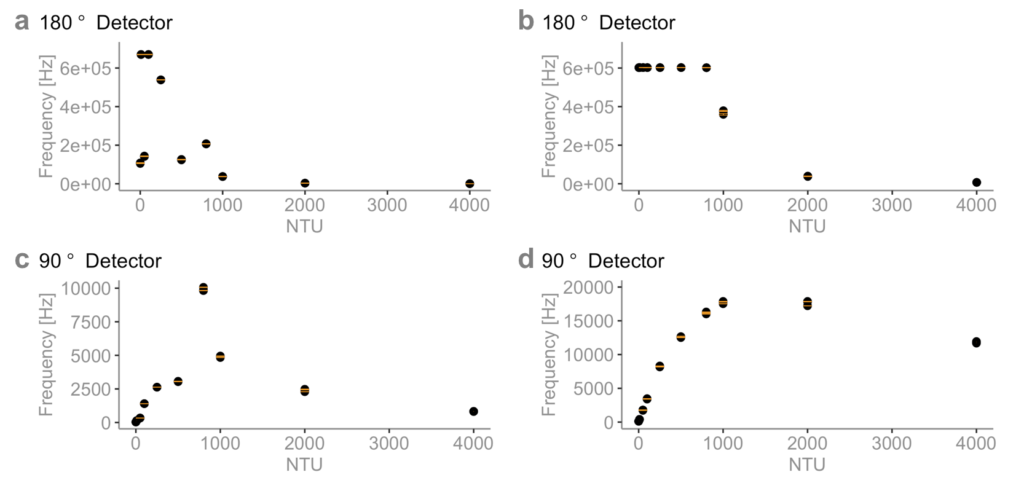
When we compare the results for Sensor 1 and 2 in the graph below, we see how necessary focusing lenses are. I’m not sure why the flat glass yields these really bad results. Maybe because I glued them by hand and didn’t align the glass properly (?)
Effect of detector orientation
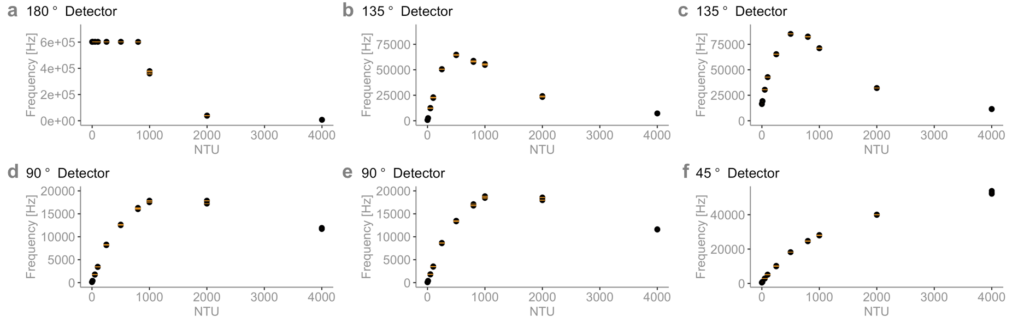
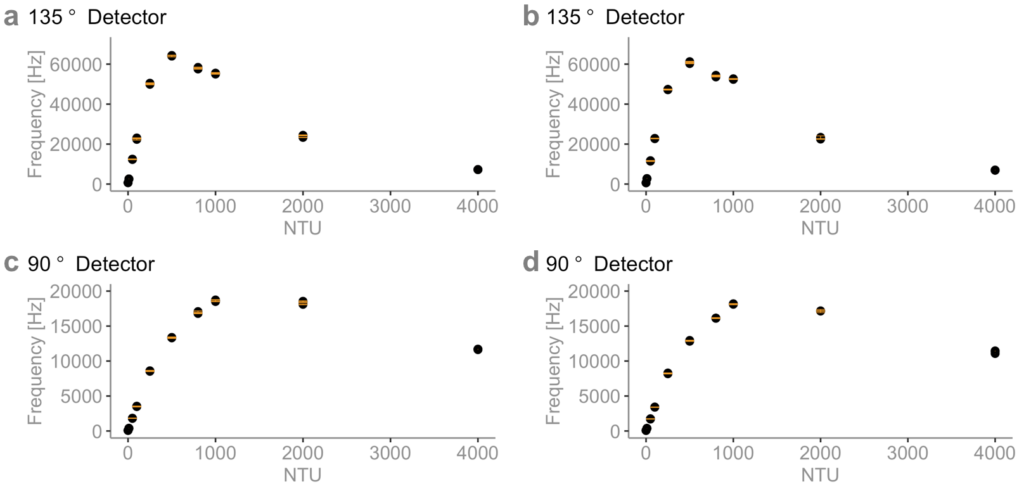
When we compare the results for Sensors 2, 3 and 4, we see that there is a clear relationship between the amount of light reaching the detectors (frequency in hertz) and NTU, similar to those reported by Sadar (1998) (see figure above). Below 1000NTU, the frequency is cut off for Sensor 2 (a), probably because the detector at this angle reaches its saturation limit. Sensors 3 and 4 report different maxima from the 135° detector (b and c). Probably from a difference in the sensors’ construction (this shows just how important calibration of these homemade sensors is). From these results, I decided to move forward with Sensors 3 and 4.
Effect of ambient light and long-pass filters
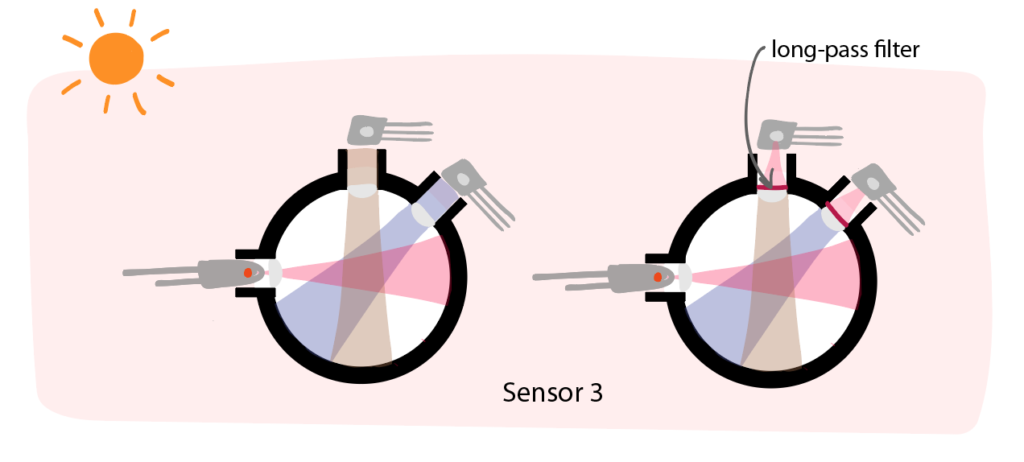
In the final experiment, we see that there is barely any difference with or without the long-pass filters (maybe a slight decrease in frequency when the long-pass filters are used). With these results, I didn’t see a compelling reason to opt for the long-pass filters. Especially since the off-on measurement seemed sufficient to eliminate stray light (also since these lenses cost 4 USD per piece).
Prototype 2.0 – latest design
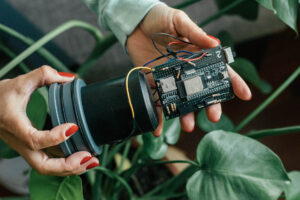
Based on the info above, I made the latest prototype 2.0. This is the prototype outlined in the previous blog posts where I explain how to make the internal electronics board and how to assemble the waterproof housing.
The latest sensor has the following features. (1) The sensor has one light source and two detectors at different angles to each other (either 45+135deg or 90+135deg; I couldn’t decide on which one to use from the review above). (2) It takes the difference between two measurements (LED off and on) to reduce ambient light effects. (3) It covers a large turbidity range 0-4000 NTU. (4) The sensor is low-cost and open-source so it can be built by users. (5) The sensor can be installed in a river system for in-situ measurements. You can see this latest version in the image to the right and you can learn how to build it yourself using this and this blog post.
References
Sadar, M. J. (1998). Turbidity science. Technical Information Series—Booklet no. 11. Hach Co. Loveland CO, 7, 8.