A simple turbidity sensor for schools using the DFRobot turbidity probes and a senseBox
It comes as no surprise, but working in academia leaves very little time to actually communicate research in an approachable way (read: not only publishing in an academic journal). So here I am, 1 year later trying to update this blog again:D
I wanted to dedicate this blog post today to a little side-project I did with some students 1-2 years ago. We built a turbidity sensor using the famous DFRobot turbidity probe and a senseBox (a popular plug-and-play microchip board that uses the Arduino framework). This is a simple turbidity sensor for schools and citizen science projects (if you want to read about our more “advanced” sensor, find that in this post). We call this sensor “Baby turbidity” and installed the sensor for some weeks in a creek behind the university campus. I will go through the sensor, collected results, calibration, BOM, and issues in this blog post, but you can also find the dedicated repo here. As a final note, this sensor compromises on accuracy for low-cost and it should be good enough for students to play with and learn some programming/environmental sensing, while also getting some meaningful results!
Description of the device
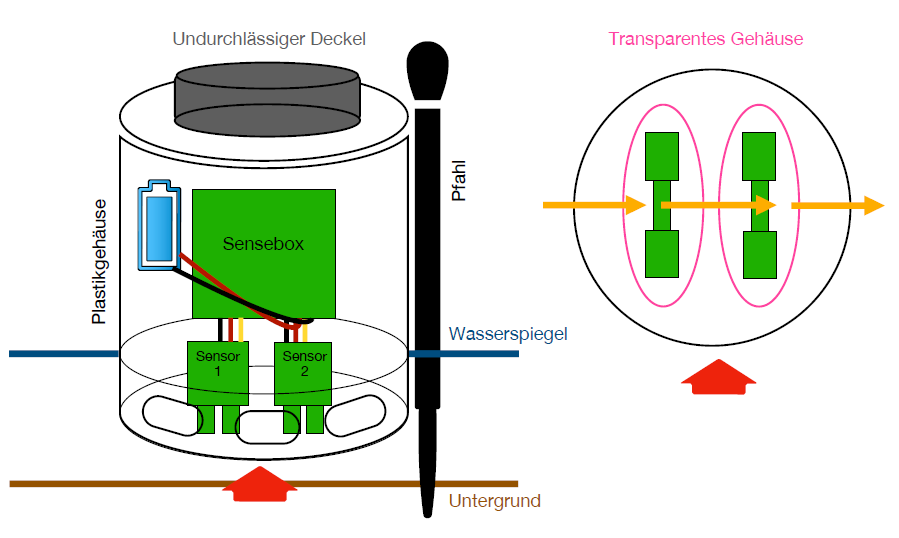
This very simple turbidity sensor consists of two DFRobot turbidity probes, it is housed in a very simple PVC housing, and it’s programmed in the Arduino framework. The “anatomy” of the sensor is shown in the figure below (forgive the German). The senseBox already has an SD card slot. And to read out the DFRobot probes, we connected them to an Adafruit ADS1115 16bit ADC.
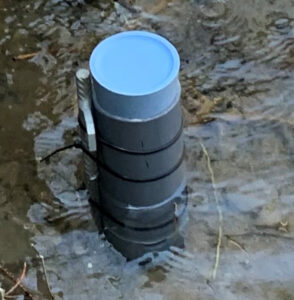
The senseBox and batteries (Fig. 1 – LEFT) are inside a homemade PVC housing. The housing was closed with a big cork, which is not the best for waterproofing but good enough for a field excursion with students or for installation in a small creek. The DFRobot probes already come housed in a transparent housing and these transparent plastic pieces were glued to our PVC housing (Fig. 1 – RIGHT … I wish I had a better photo of this but I don’t). This was done so that the turbidity probes can be directly connected to the senseBox while staying dry and still taking measurements through the small DFRobot transparent housings.
Example results
Below you can see some results (Fig. 2) obtained using the sensor for two different time periods in April 2020 in the Holderbach river in Zurich (a small creek behind the university). The top panel in each figure shows the turbidity (in NTU) measured by both probes (blue and orange curves – since our device had two DFRobot turbidity probes).
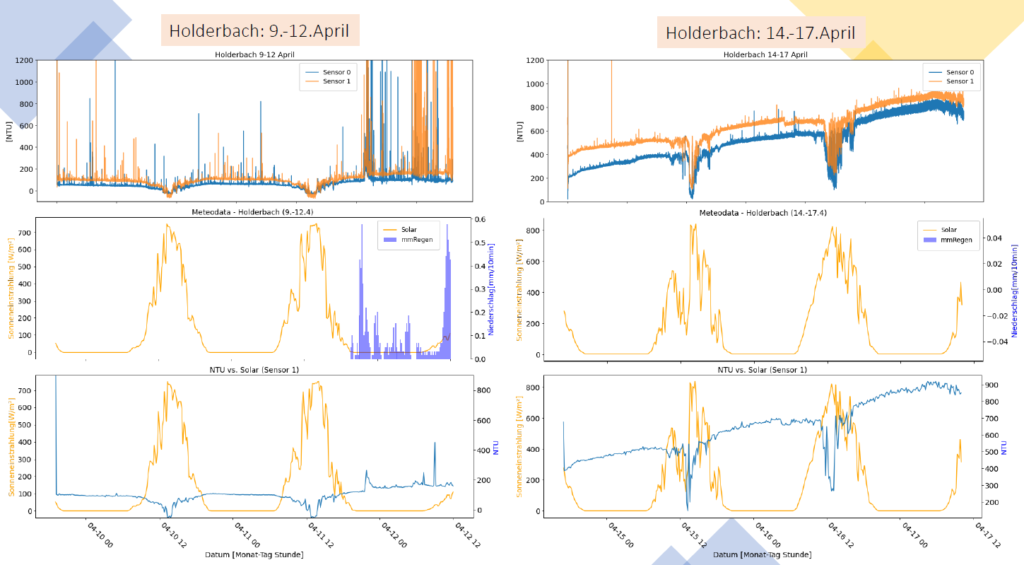
The middle panel in each figure shows the solar radiation (yellow curve) and the precipitation in mm/10min (blue bars). This data was provided to the students.
The bottom panel in each figure shows again the solar radiation (yellow curve) and the average NTU of both probes (blue curve). We see some very interesting findings in the figures below.
The figure to the LEFT shows that the NTU measurements are influenced by solar radiation but also around April 12th we see some spikes in turbidity which correspond to precipitation. The MIDDLE figure shows no precipitation but there is anyways a constant increase in NTU. Perhaps this is because the sensor is getting dirty? Or maybe because the turbidity of the river was increasing? The last figure to the RIGHT shows increases in NTU corresponding to precipitation, also in the absence of solar radiation.
These results show that the sensor is able to measure changes in turbidity, but also that these measurements are affected by solar radiation (see section below). The students also measured the turbidity in two more Zurich rivers (the Sihl and the Limmat) and those results can be found in the folder “Results” in our Github repo.
Bill of Materials (BOM)
- 2x DFRobot turbidity probe
- 2x Adafruit ADS1115 16BIT
- 1x senseBox MCU
- 1x GPS receiver
- 1x SD bee
- 1x Illumination sensor (option – this data was already provided to the students)
- 1x Battery pack
- 3x AA batteries
Code
I have included a basic code in the repository to obtain the turbidity from the ADC. The code is called turbidityCalibrated_sensebox.ino and can be found in the folder “Codes.” The senseBox uses the Arduino framework so if you would rather write your own code, the Arduino library is a good place to start with example codes for SD card usage. Or the Adafruit library for the ADC. SenseBox also has example codes for each of its products.
If you would like to read out from a temperature and/or humidity sensor then you can check out Codes/temperature_humidity.ino. And if you would like to save to an SD card then check out Codes/SD_temp.ino.
Calibration
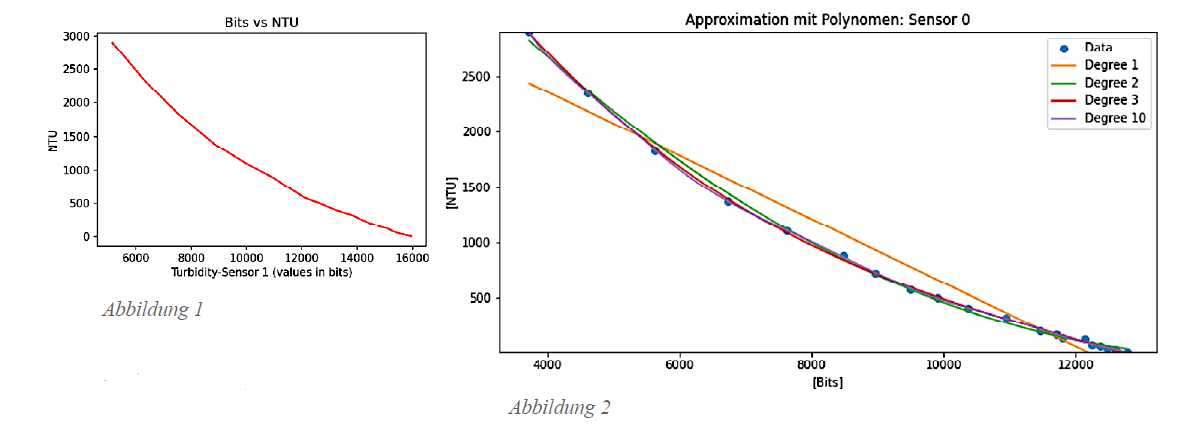
Commercial sensors use Formazin (or some other similarly expensive liquid polymer) to calibrate their sensors. But Formazin is carcinogenic, so I have found that a good alternative for the students is soy milk! To calibrate the sensor(s) using soy milk, follow the procedure outlined in Calibration/calibration.pdf in the repo (you will unfortunately need one of these commercial-expensive sensors to do this calibration). Below you can see an example of the calibration curve our students obtained (Fig. 3 – LEFT) and the polynomials they fitted to their curves (Fig. 3 – RIGHT).
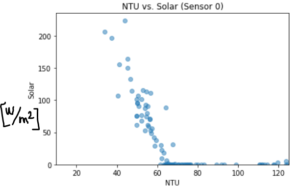
Correlation with sunlight
As the figure below demonstrates, these cheap DFRobot probes are affected by sunlight which is why we had to calibrate them in a dark room (please forgive my hand-drawn units… the students forgot to add the units and I don’t have access to the original figure).
Final notes
- This sensor doesn’t have a wiper so biofauling would be a problem and the sensor shouldn’t be installed long-term without regular maintenance
- The cork isn’t the best for a waterproof housing